Data Sketches is the book I co-authored with Nadieh, published February 2021 via CRC Press. It still feels so surreal that I often forget I have a whole (or rather, half a book haha) under my name. I only remember it when my husband or a friend brings it up or asks me about it, and I’m like—oh yah, that happened haha.
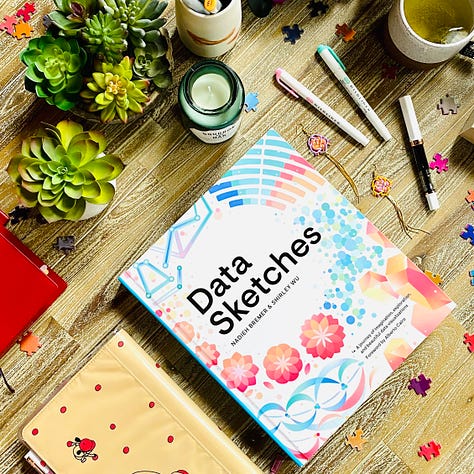
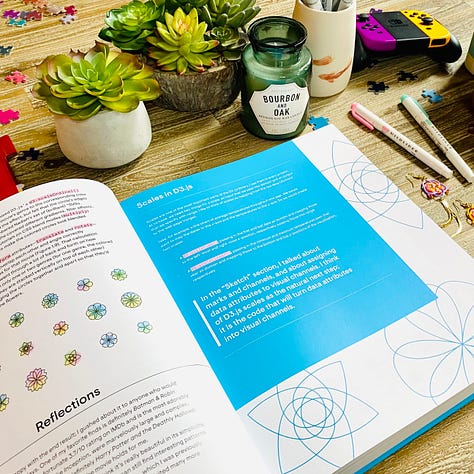
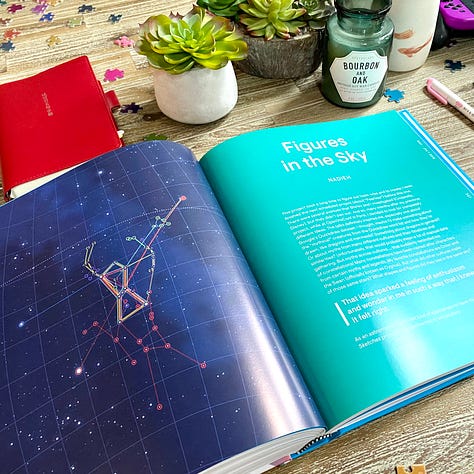
(Which is also silly because the thing dominated my life for a whole five years lol.)
(I should also give a little background of what it is: Data Sketches started as a web project between Nadieh and I in 2016, where we chose twelve topics and each went out to gather our own data, sketch our own designs, and code a data visualization from scratch. We also decided to document our process behind those 24 projects, and that documentation became popular enough that we were able to sign a book deal for it in 2018—thank you Tamara for advocating for us and the type of book we wanted to make 🙏)
In June 2021, we found out that our publisher was in talks with a Chinese publisher, and then I found out that Dr. Catherine Ma (who I had become friends with via a Kontinentalist article) had signed up to do the translation, and my excitement was through the roof.
(Can I spend a few moments gushing about Catherine, who not only is an incredible data journalist but also is a certified English-Chinese interpreter?? And translated our 400+ page book in a month during the last year of her PhD??? I have so much respect and admiration for her, and I couldn’t have imagined a better person to translate our book into Chinese. Also brava to the international data visualization community that also made the book and then the translation possible!)
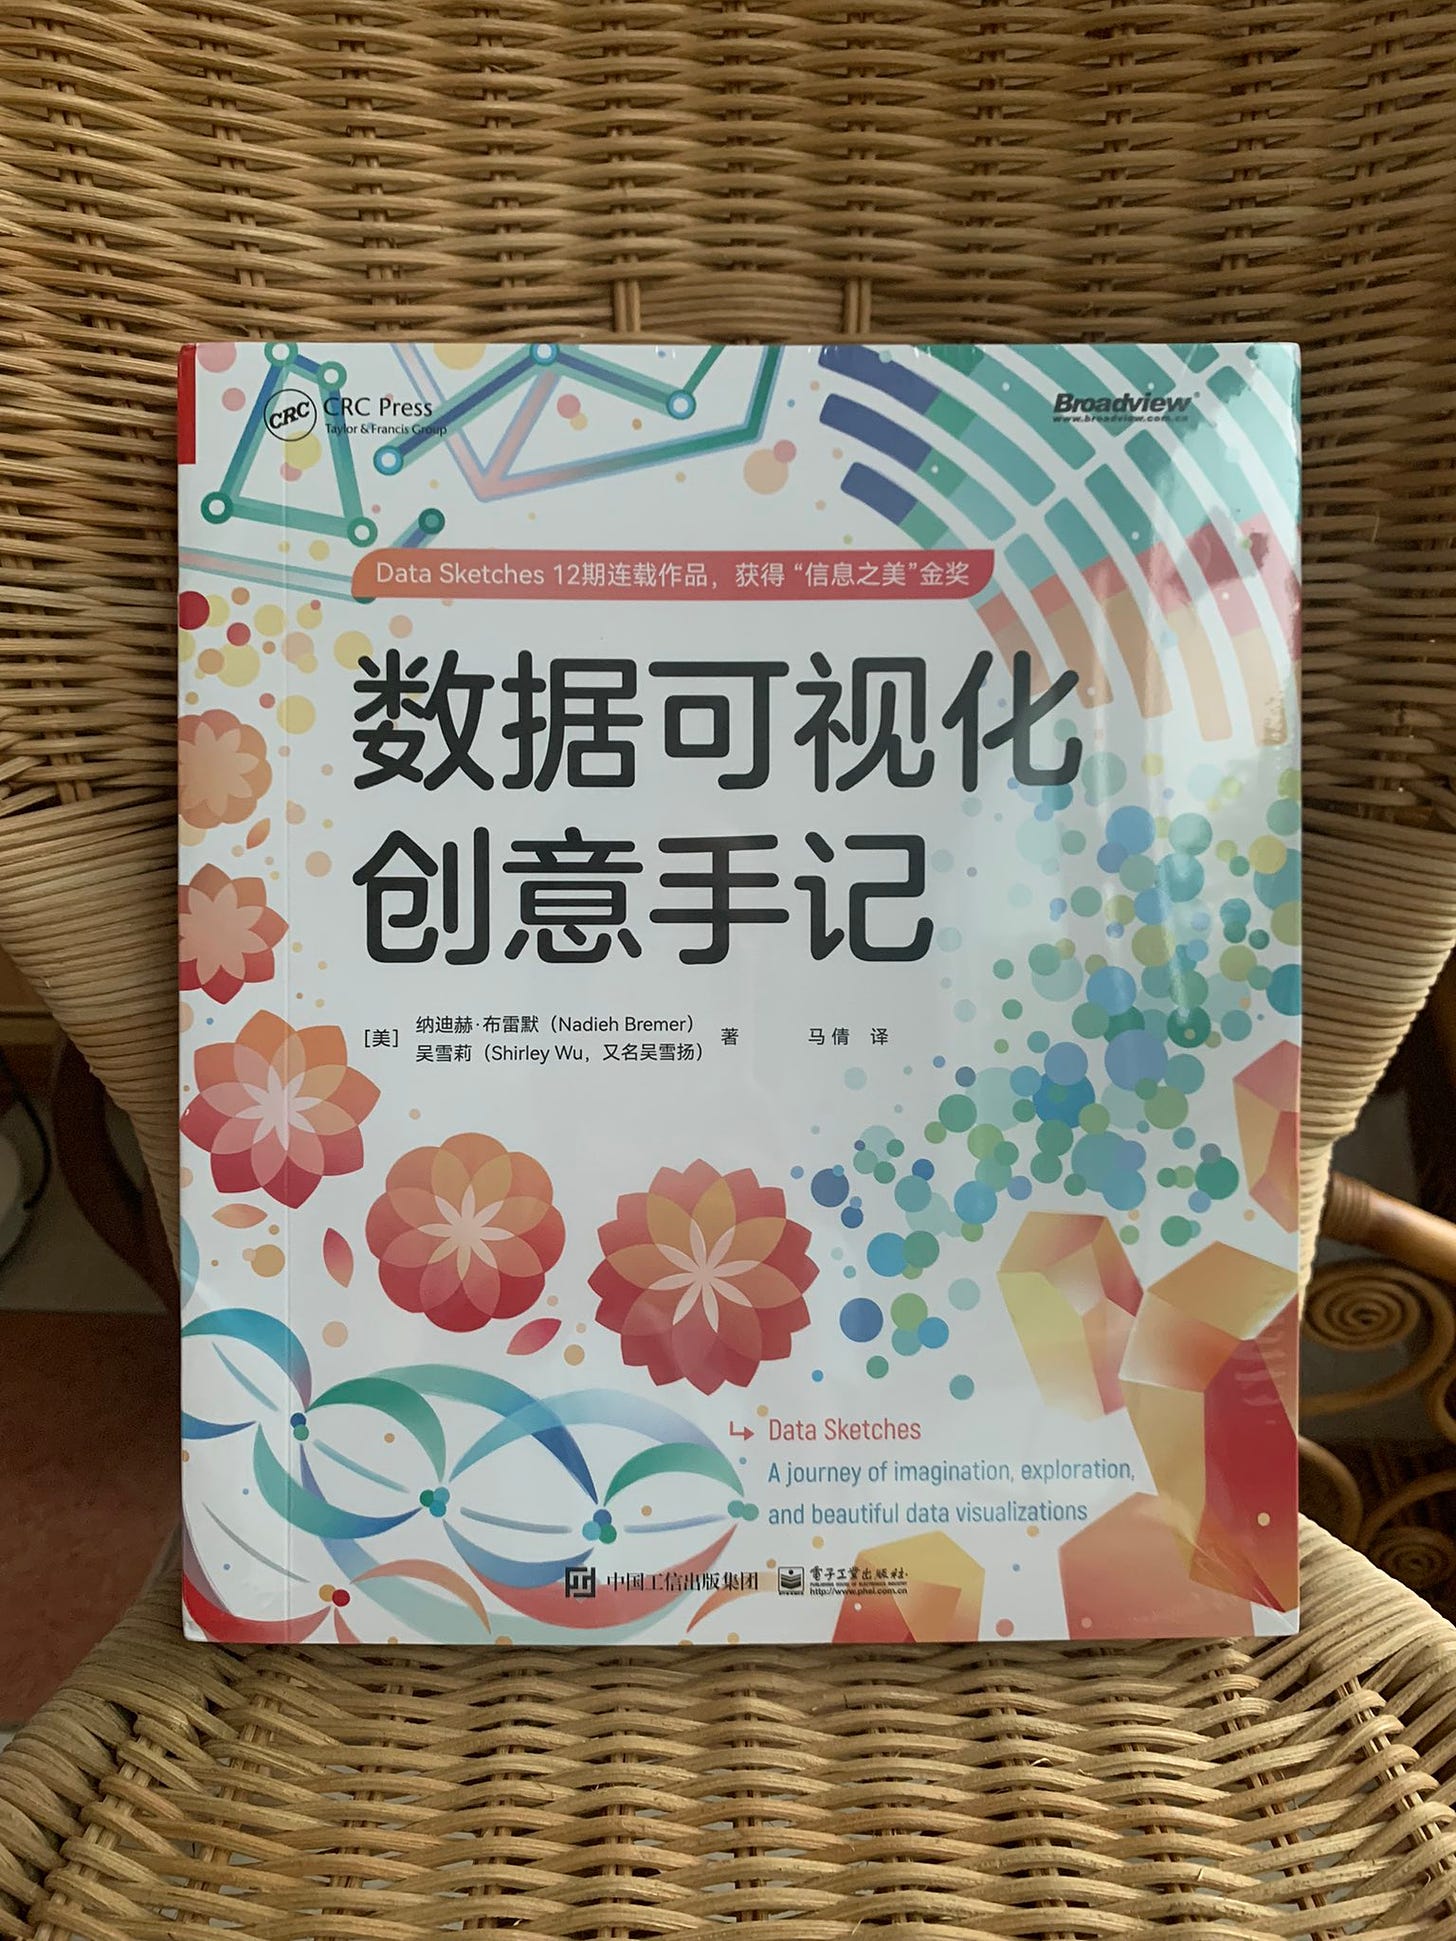
I have to admit, I might have been even more excited for the Chinese translation than for our actual book publishing. In our original book contract, there was a subsection about international translations—and I was like, it’d be so cool if this got translated to Chinese so that my parents and grandparents could read it, but that’s probably never going to happen so let’s not get my hopes up. My parents and I have always had a language barrier—my Chinese is elementary, and so is their English—and though they’ve never helicopter parented me or forced me into a career, they also still don’t quite understand what I do (and why I’ve chosen the career path I have haha). And though they were proud of my publishing a book, I don’t think they’ve ever done more than flip through it, because 400 pages is just way too much English for them to read through. And for my grandparents that speak no English (but did memorize the Chinese word for “data visualization”, “数据可视化” for me haha), all they could do is flip through and look at the images.
So it means more than I could ever describe in words what having this Chinese translation means to me. It means that perhaps for the first time I’ll be able to communicate to them in their native language the complexities of my thoughts, feelings, aspirations, and struggles, why I’ve chosen the career path that I have, where I’m hoping to go from here. I didn’t realize until we got a Chinese translation, how much I (and my younger self, and all the years I’ve spent arguing with my parents because of some miscommunication our language barrier caused) needed that. It means the world to me.
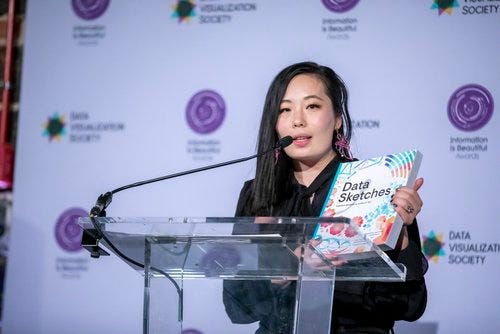
Last December, Data Sketches won the Exemplary Book special award at the Information is Beautiful Awards out of twenty-something books. And I keep thinking about what Nadieh and I wrote when submitting our book to the award:
How has this work impacted the data viz field? (100-300 words)
“Data Sketches” started in 2016 as a series of 24 data visualization projects and their corresponding documentations online. From the beginning, we have heard from beginners and veterans alike how insightful, helpful, and refreshing it is to be able to see the full creative process, and how much value it adds to the final works. We have had professors tell us that they show “Data Sketches” in class and point to it as a resource for their students, and we have also heard from students that they share it with their classmates to get them excited about data visualization as a field. Because of all this feedback, we were motivated to create a book version that gives structure to the documentation, with callouts for specific data and design lessons we learned and full-page write-ups of how to approach specific technologies.
Books are also powerful and legitimizing, and through this book we normalize all the “failures” that come with creating data visualizations. We’re honest about all the twists, turns, forks, bends, spirals, and the countless iterations most of our 24 projects have taken, that we rarely come up with the perfect design from the very start, and that we won’t always be 100% happy with the end result—and all of that is beautiful. It’s part of the growing process.
Our works are also “un-orthodox”, in that they don’t adhere to the “recommended” styles that used to dominate the field: minimal, austere, with a muted color palette. Our designs are often vivacious, lush in colors, complex in detail, and at times very “cute” and feminine. And to have all of that be encompassed in a big, colorful book is, again, very powerful and legitimizing. We’re excited by all the vivacious, colorful, and complex data visualizations we’re already seeing in the field.
Mike Bostock in his endorsement said it best: “their openness and humility make the practice less intimidating, inviting newcomers to get started.” And indeed, we have received countless photos of toddlers enticed by the colors and flipping through the book, kids crouched over the book intently reading (with their backpack still on and the book still partially in its box!)—that, we believe, is the biggest impact our book has had on the field.
And I hope our Chinese translation will also resonate in this way.
💖,
Shirley
p.s. If you’ve received the Chinese translation, I’d love to hear what you think about it (because I still haven’t received my copy haha), or if you know someone who would love it—I’d be so grateful if you share it with them ✨


